
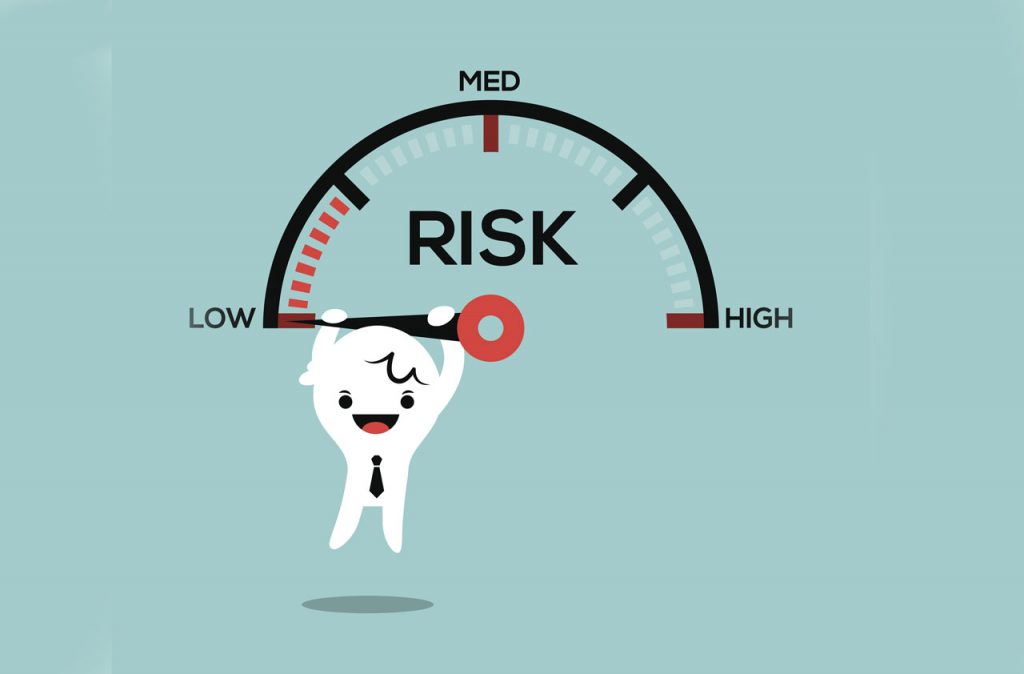
Ways to help 401k participants understand the risk of their portfolios
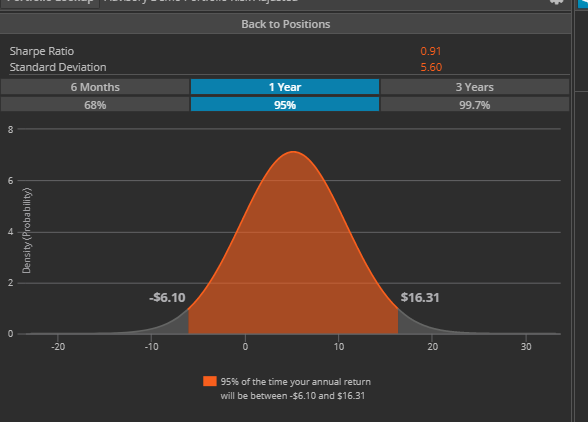
One of the most obvious ways to look at the risk of portfolio is by checking its standard deviation. Standard deviation is a statistical measurement that sheds light on historical volatility. The higher standard deviation is the more risk a portfolio has. Also, looking at Value at Risk will give you an approximation of possible loss/gain over specified period of time with selected degree of confidence. For example, the annualized standard deviation of well diversified portfolio on the screenshot is 5.6, whereas the annualized standard deviation of SP 500 is about 10.
So, the portfolio analyst can conclude that diversified portfolio is less risky than SP 500. Also, the distribution chart below can be interpreted as that the diversified portfolio can lose no more than ~6.1% or gain no more than 16.31% over 1 year period based on the confidence level of 95%. In other words, this is a loss/gain probability bend if portfolio moves 2 standard deviations over the period of 1 year.
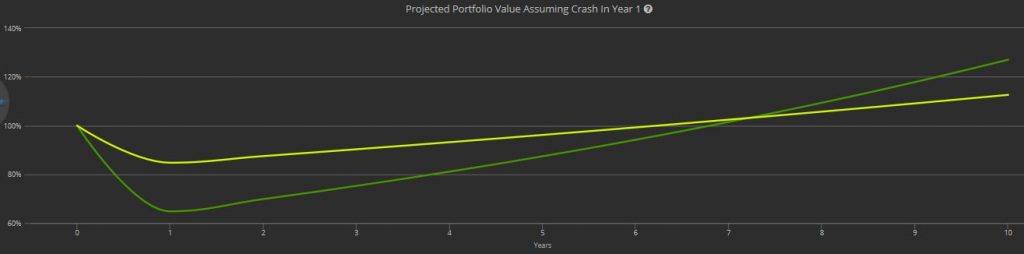
Another way to help people understand risk is to make sure they understand the risk & reward aspect of investing, and how that relates to their future goals. If someone isn’t planning to retire for decades down the line, they are more than likely in need of a more aggressive portfolio. While they may have a less stable return in the short term, their long term return will definitely pay off. While using advisor tools such as the Portfolio Crash Test, we can see a great example of a conservative portfolio’s short term gains and losses vs a more aggressive portfolio.
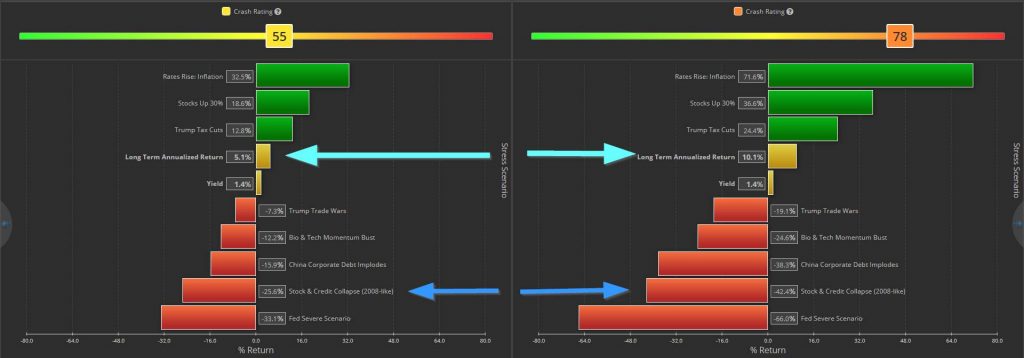
Comparing the long-term annualized of return between two portfolios can highlight the different projections. A client may naturally be inclined to prefer the portfolio with the higher long-term annualized return. Portfolio Crash Test allows you to simulate a crash at any point along the client’s horizon.
Depending on the client’s horizon, the visual representation can show the advantage of being in a less risky portfolio in the event of a crash.
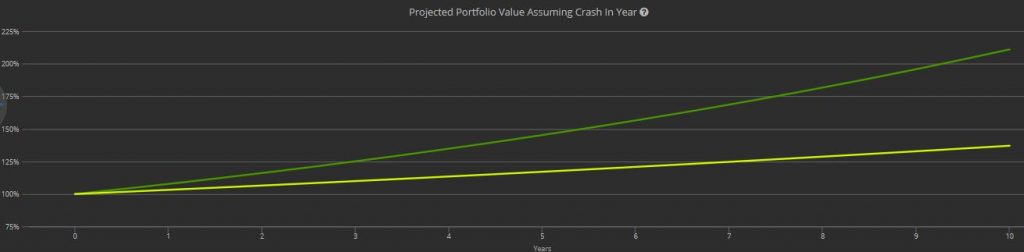
Inversely, a younger client who can afford to take on more risk can be shown that even if there is a crash or two, that the more risky portfolio will eventually overtake the less risky portfolio.
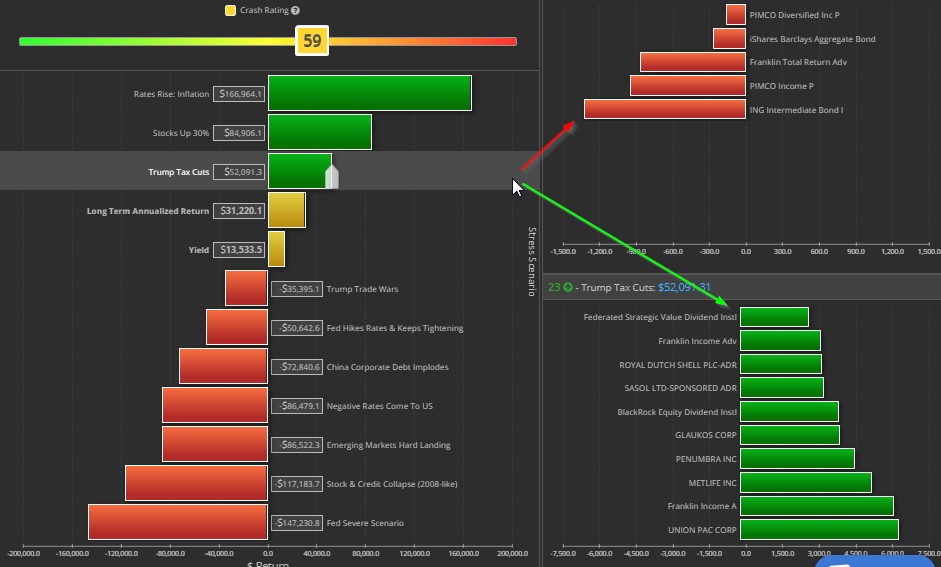
Another way to help 401k participants understand the risk of their portfolios can come from investigating loss and gain factors in major scenarios. Loss and gain factors are shown in certain funds behavior, based on different historical scenarios.
In some cases, if you can take a closer look at your portfolio line-up and diversify it with better investment options, the whole portfolio will become less risky and potentially more profitable:
These are just a few key ways of illustrating and trying to connect with the client so that they have a better understanding about risk.