Clearly, stock market feels different now than it did at any point over the last few years. In this note we will look at two important indicators to understand if we are facing a market rout or merely a correction.
The two crucial indicators we will consider are junk spreads and Fed Funds Rate. As a reminder junk spread is essentially the difference in yield on a lowly rated financial instrument, say CCC, and a Treasury bond of similar maturity. Therefore, junk credit spreads provide a great idea of how investors take risk in an economy. That is because investing in companies just one step above bankrupt is the nature of risk taking. Therefore, junk spreads are uniquely suited to measuring attitudes toward risk.
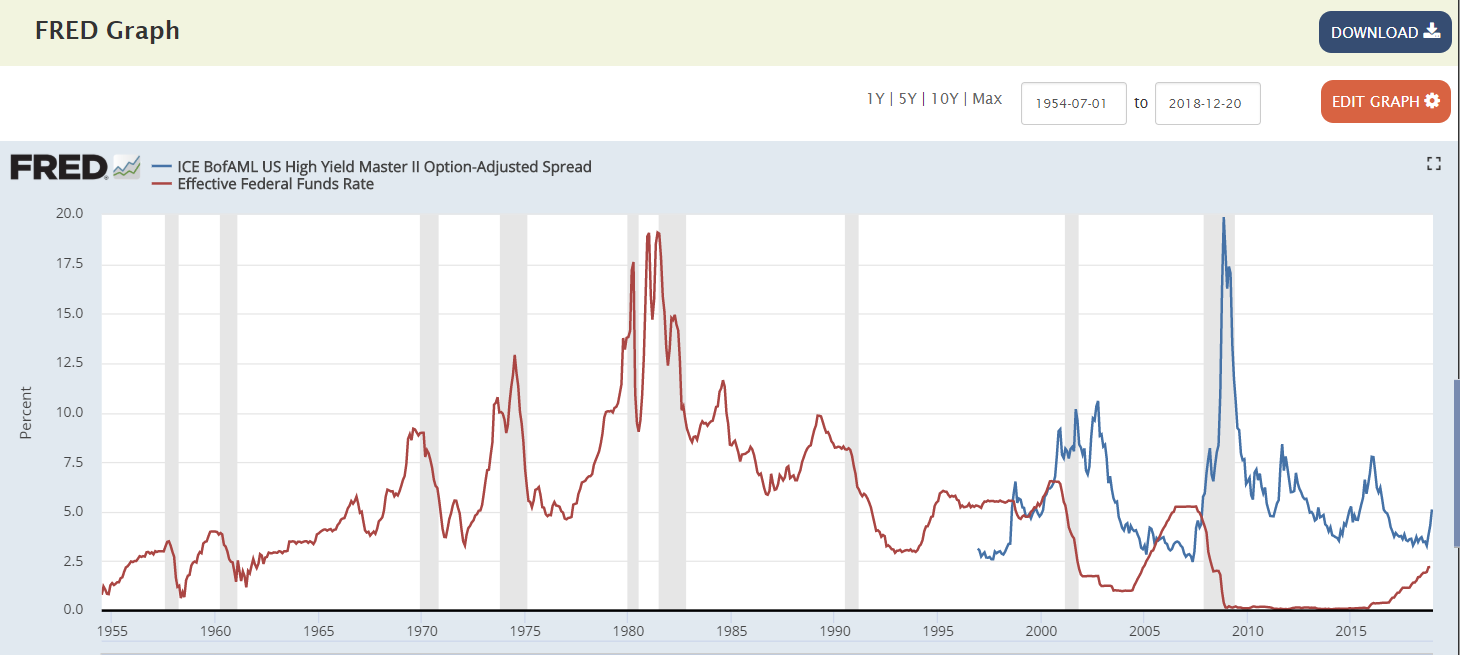
Junk spreads are a well established leading indicator for risk appetite. Junk spreads rise significantly in the first stage of what is known in economics as a Minsky moment. In his Financial Instability Hypothesis, Hyman Minsky suggested that during times of growth all companies increase their leverage past the optimal point. This morphs high growth companies into speculative ones, and it moves speculative ones into what he called Ponzi finance. When the credit cycle turns and rates start to rise Ponzi finance starts to break down. We are not just talking about the Fed raising rates, which is what everyone is fixated on today. Fed taking over the supposedly free markets to such a degree as today wasn’t a thing in Minsky’s time. He was referring to rates at which corporations can borrow. And those can move very differently from the Fed Funds Rate. However, they are clearly related, though usually with a lag. Let’s consider the graph of junk credit spreads (blue line) with Fed Funds Rate (red line).
Not There Yet.
First off, we can see that today’s rise (data point all the way on the right) is not even close to 2008 crisis, but it is not yet close to junk spreads in 2003-2004 or 2012 and 2016 for that matter. So, purely on a level basis we have ways to go before it becomes a real warning signal.
Keep rates low, sow the wind. Raise them, rip the whirlwind.
Now we are seeing an increase in Fed Funds Rate from a very low level just in like in 2006/2007 and in fact in 1960’s (though in 60’s the notion of a low Fed Funds Rate was admittedly not what it is today, as zero and negative rates seemed like something out of a lunatic asylum). Regardless, all increases in the Fed Funds Rate from protracted low levels resulted in crises. That is exactly what Minsky observed. Protracted low rates set the stage for Ponzi finance. If rates do not increase, Ponzification of the financial system continues. When they do, deleveraging and liquidation cycle ensues.
Raise now – sell later.
Note also a lag between the two series, as the Fed is raising rates from low levels in 2006/2007, spreads follow furiously upward later in 2008. This is agreement with Minsky’s theory, as it takes time for Ponzified companies to run out of data.
This analysis would suggest that we are only in a very beginning stages of deleveraging. We could wait a year or two to see a real downturn, because junk spreads are still relatively low. However, if Yogi Berra taught us anything, it is that “Predictions are hard to make, especially about the future”. That is why I suggest you add this chart to your daily or weekly routine. You can access it here, then click Edit Graph in the upper right and add Effective Funds Rate. If rate increases combined with junk spread increases continue to resemble something like 2007, time to get out.
In the meanwhile, you can reallocate to value stocks, which have been neglected greatly and have some life in them. In the next entry I will consider stock buybacks, another major piece of the puzzle. Slowly, you will add all the charts you need to make risk allocation decisions intelligently. Also, I highly recommend our Portfolio Crash Testing software, which was built for professional risk managers and now available to financial advisors. You can request your demo HERE or by clicking on the banner below and understand your client’s risk allocations and risk tolerance much better.