Capital Expenditures vs Share Buybacks: How Do Investors Want Companies to Spend?
I recently published an article discussing an op-ed written by Chuck Schumer and Bernie Sanders where one of the ideas they put forth was to create a (undefined) mechanism to discourage corporate buybacks. Recently Marco Rubio joined in with his own version of the same theme (still scant on details, but at least he said his proposal would focus on tax policy to discourage buybacks and encourage investment). This may mean that there is a bipartisan path forward on a proposal that would discourage companies from buying back stock. The rationale is that by making buybacks less attractive, investment through capital expenditures would be the obvious alternative, especially if there was an incentive tied to such investment. And more capital expenditures are good for the economy.
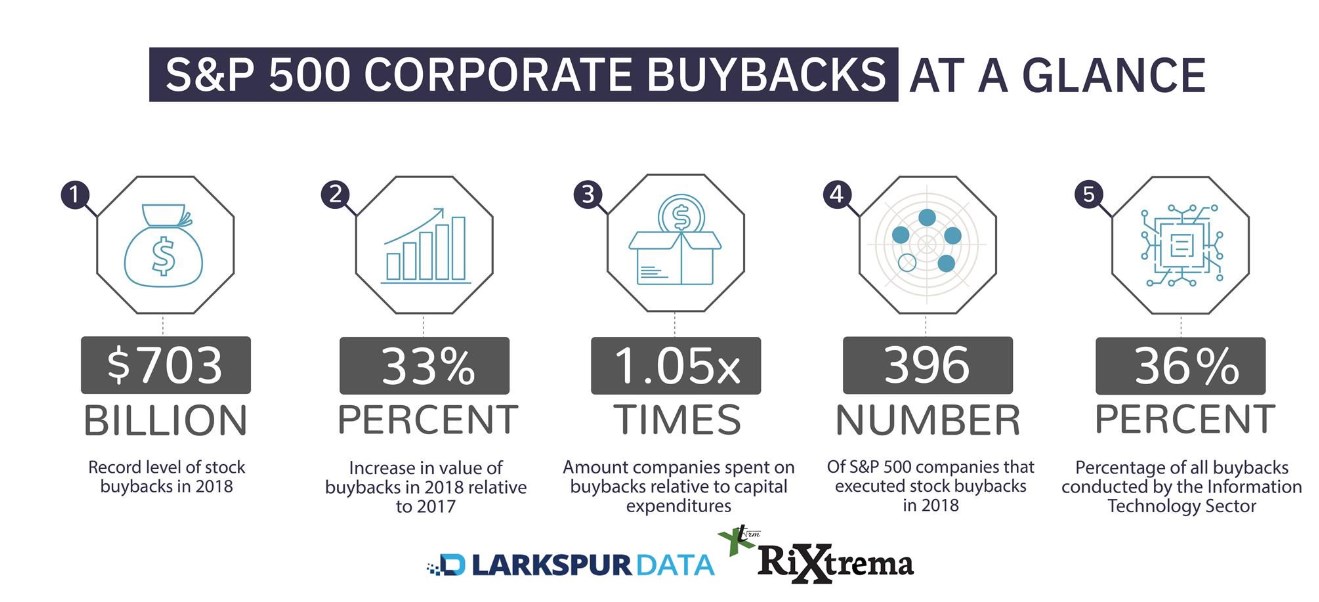
While corporate buybacks have been getting attention for years, the focus was intensified in 2018 because of the increase in buybacks as a result of the corporate tax windfall. The chart below shows how abnormal the buyback levels of 2018 were. Both the absolute level of buybacks that occurred and the ratio of buybacks to dividends as a means of returning capital to investors was at an all-time high with a 30% increase in the level pf buybacks relative 2017. As a contrast, dividend payouts decreased by 6%. But this hides the fact that capital expenditures were also at record levels in 2018 and increased 16% from 2017 levels.
Exhibit 1: Russell 3000 Buybacks, Dividends, and Capital Expenditures
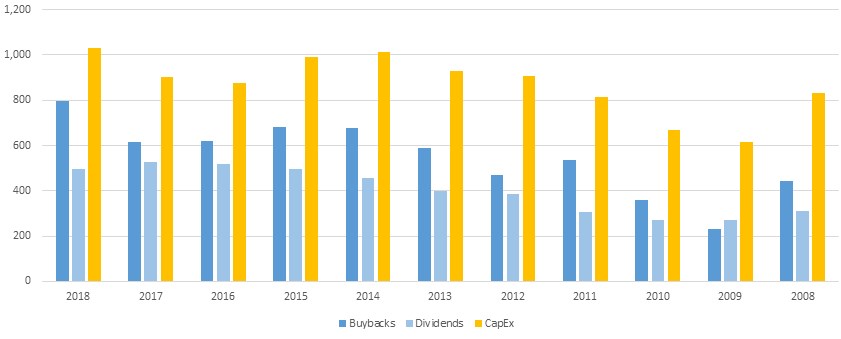
Source: Bloomberg, RiXtrema
It should be noted that we are using the Russell 3000 as a basis for this comparison. On the more widely followed S&P 500, the level of corporate buybacks outpaced capital expenditures. But using the broader market gauge of the Russell 3000, capital expenditures were still on top though the ratio of capital expenditures to buybacks was at a low. Meaning that the level of buybacks in 2018 was very high relative to capital expenditures given the trend of the last 11 years no matter the benchmark. Indeed, this ratio has been trending lower for the last 11 years.
Exhibit 2: Ratio of Capital Expenditures to Buybacks in the Russell 3000
![]()
Source: Bloomberg, RiXtrema
One of the points made by Schumer and Sanders was that companies are choosing to do stock buybacks instead of investing in their future. My perspective is that given the choice of sound reinvestment for the future of the company versus a corporate stock buyback, a company will choose investment every time. And investors would, usually, prefer this to be the case. After I wrote the article, I wondered if I was correct – should investors prefer companies that make investments in capital expenditures over those that invest in buybacks? It makes intuitive sense, but when discussing investments, it is best to let the data tell the story.
Luckily, Nasdaq has two similarly constructed indexes I could use as the basis for this comparison. The Nasdaq Buyback Achievers Index includes companies that have repurchased at least 5% of their assets over the last 12 months and the Nasdaq U.S. CapEx Achievers Index that tracks companies that have increased their capital expenditures over the last 3 years. The companies are pulled from all US stocks, (not just those listed on the Nasdaq) and are weighted using a ‘modified market capitalization’ methodology. Exhibit 3 shows the performance of the indexes since March 2007, which is as far back both data sets go.
Exhibit 3: Performance of the Nasdaq CapEx Achievers Index vs. the Nasdaq Buyback Achievers Index
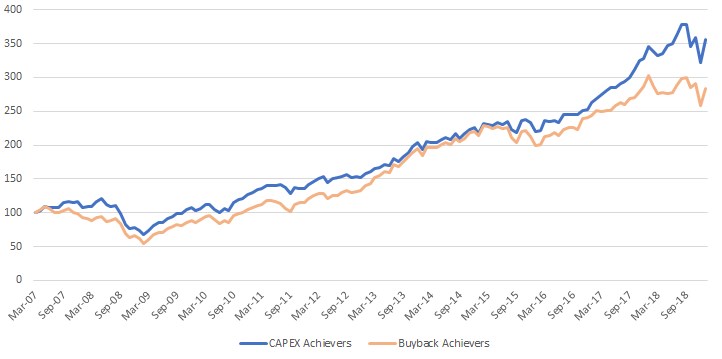
As seen in Exhibit 3, if someone invested $100 in an index in March of 2007, they would be better off having invested in the CapEx Achievers Index. In fact, the $100 CapEx investment would have increased $71 more than an $100 investment in the Buyback Achievers Index over the course of almost 12 years. The bottom line is that the CapEx Achievers index has outperformed the Buyback Achievers index by 220 bps per annum. Note that a company can be in both indexes: it can buy back 5% of stock and increase capital expenditures over the previous three years. Currently only 15 companies are on both lists, but a weighted composite of those companies would have returned almost 13% over the past year (though the individual returns diverge significantly in that group).
The CapEx Achievers Index also has superior risk adjusted returns relative to the Buyback Achievers Index. And it really doesn’t matter how you look at it, the CapEx Achievers Index performs better than the Buyback Achievers Index with the exception of one period: from 2011-2014 where the Buybacks outperformed CapEx by 5.3% per annum. But comparing these indexes to each other hides an important point: since 2007, both indexes have outperformed other major broad-based US benchmarks like the Russell 3000 and the S&P 500.
Exhibit 4: Risk Adjusted Performance and Performance by Period
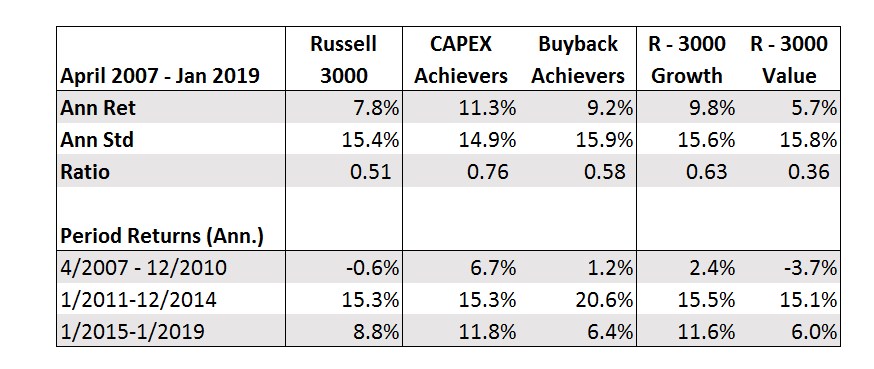
Note: Return calculations assume dividends are reinvested in the index
These results made me wonder what environment buybacks would outperform capex companies and when would the opposite would be true? What biases are in the indexes that would enable them to outperform each other and the broad market? The logical place to start is to identify the styles that most defines each index. Styles are commonly categorized by size (large/small) and value/growth characteristics. If an index (or fund) is constructed such that it exhibits a certain style, then this bias will impact performance. Unsurprisingly, from a style perspective the Buyback Achievers Index looks more like a broad market index while the CapEx Achievers Index resembles a growth index.
Exhibit 5: Style of CapEx and Buyback Achievers and Benchmarks
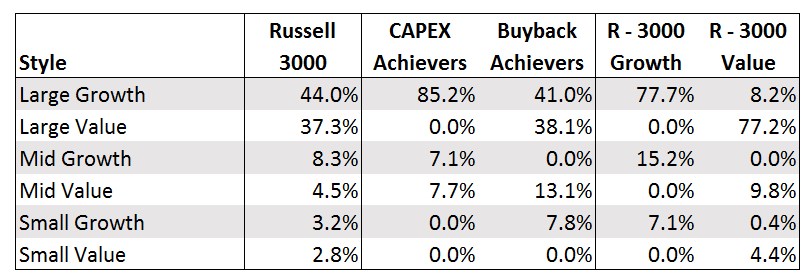
Source: Bloomberg, RiXtrema
This affirms that virtually any company might look to buyback stock when confronted with the enviable position of having excess capital that can’t best be used for reinvestment. Buying back stock will return cash to shareholders in a more tax-friendly manner than a dividend and improve valuation metrics like earnings per share (by removing shares from circulation, EPS is increased by shrinking the denominator). Plus, a buyback would be the best way to return capital without obligating the firm to future scheduled payments. Growth companies generally don’t pay dividends, so they might be predisposed to a buyback versus a dividend. Another reason that growth companies generally do not pay dividends is because their reinvestment opportunities are often perceived as the best use of capital – shareholders will receive a higher return on the reinvestment than if the company simply pays a dividend. So it is not surprising that companies that increase their capital expenditures when they have excess capital tend to be growth companies.
Using historic correlations as another way to look at bias, the CapeEx Achievers Index had an extremely high correlation to the Russell 3000 Growth Index while the Buyback Achievers Index had a very high correlation to both the Russell 3000 and the Russell 3000 Value. The correlation of the CapEx Achievers to the Buyback Achievers was nearly identical to the correlation between the Russell Value and Growth indexes.
Exhibit 6: Correlations of Various Indexes
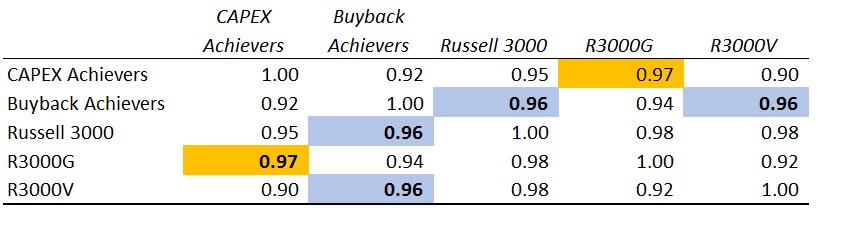
Note: Correlations are monthly from April 2007 to January 2019, the longest common time series.
Finally, I wanted to look at annual performance of the indexes. Interestingly, in 2018 when buybacks received the most attention, the Nasdaq Buyback Achievers Index was the worst performing index examined, losing 9.9% for the year. This could be because there were so many companies doing buybacks that investors didn’t see this as an important consideration when investing. Possibly, stocks doing significant buybacks were punished because investors perceived that there was better uses for the cash than a buyback. Whatever the case, investors have already weighed in with their opinion that they would prefer companies to invest their windfall rather than buyback stock.
Exhibit 7: Annual Returns of Various Indexes
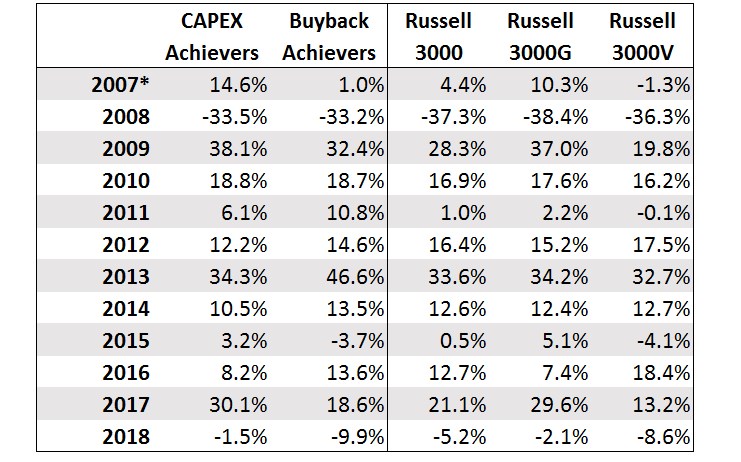
*Return calculation for 2007 is from April 2007 through December 2007 as not all indexes had history for all of 2007
To answer the original question – should investors prefer companies investing through capital expenditures to those doing buybacks? If the last 11+ years is any indication, then yes, from a pure return and a risk adjusted performance perspective, the Nasdaq CapEx Achievers Index was the best performing index indicating that investors do indeed prefer that corporations invest in capital expenditures. But the last 11+ years have favored growth companies and investors need to be aware of the growth bias in this index. In a period where value outperforms growth, the CapEx index could certainly underperform.
Note that the folks at Bloomberg Intelligence also wanted to answer this question and published an article with similar findings (subscribers to Bloomberg Professional, please see article titled “High Capital Spending? There’s No ETF for That”).

although, in the long run, cap ex is negatively correlated with payrolls, only adding to the secular problem of low wages, low retail spending and low GDP growth. Use the money to pay people??